Blog
11.21 /14
New York Taxi Service GPS System Used To Analyze Hurricane Sandy Traffic Impact
9 years ago
When Hurricane Sandy made landfall on Oct. 29th, 2012 it quickly became the second most costly hurricane in U.S. history, with estimated damages of $65 billion dollars. The New York City transportation system was a major victim of the storm, with the Transit Authority stating that the destruction caused was the worst disaster the subway system had endured in over a century. Seven tunnels were flooded, along with many train and bus stations. Traffic was disrupted for a week in the city. However, the evacuation efforts went off without a hitch. This impressive fact prompted researchers at the University of Illinois to analyze the New York transportation system. Their goal is to assist their local authorities in evaluating how resilient their own transport system is to extreme weather conditions.
The researchers used data from the taxi systems GPS units to observe the changes in traffic patterns during hurricanes, snowstorms, and other weather events. Dan Work, assistant professor in the Dept. of Civil and Environmental Engineering and Brian Donovan, a graduate student in the Sustainable and Resilient Infrastructure System program designed a method to compute the distribution of travel times between areas of the city. Their method allows them to determine the pace of deviation of taxi trips during the hurricane. They analyzed 700 million taxi trips from a period of four years, a range including pre-Sandy and post-Sandy, as well as the time the city was affected. Their analysis showed that traffic in New York was returned to normal relatively quickly.
"The first step was to figure out from the data what is normal," Work said. "There is a heartbeat pattern to the city every single day…The data shows us the typical heartbeat, and then we look for the arrhythmia."
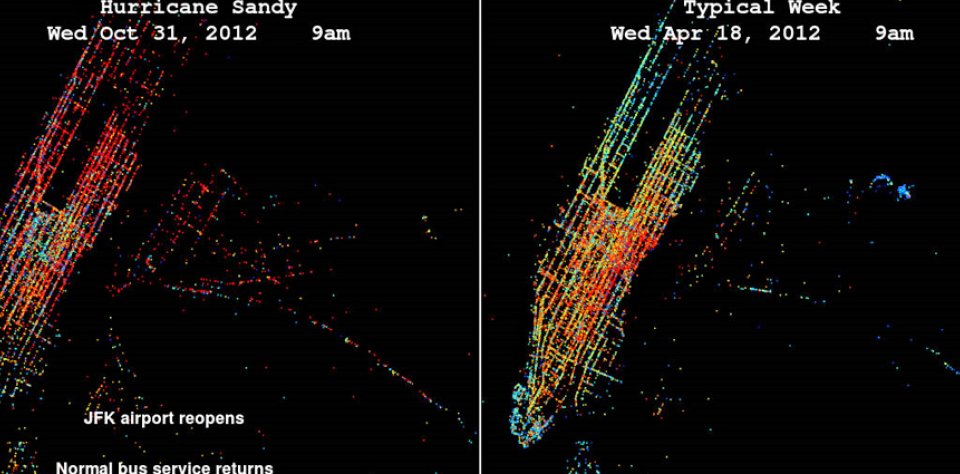
Work and Donovan created a visual map of GPS data from the taxis in the days following Hurricane Sandy, then compared it to another visual map they created from data gathered in normal traffic conditions. Analysis of the maps showed them that the longest delays happened when residents returned to the city after evacuation. Though surprised by the data, it made them realize that the process of returning residents to their homes is just as vital to smooth transportation within a city as the initial evacuation itself. It is especially applicable to the need for unencumbered movements of emergency workers and crews throughout a city while restoring functionality.
The researchers received their data from the New York City Taxi and Limousine Commission, which was provided under the Freedom of Information Law.
This article is my 44th oldest. It is 421 words long, and it’s got 0 comments for now.
